All insights
May 8, 2026
Behavioral Health Analytics Platform for Completion Rate Analysis
Learn how behavioral health leaders can use completion-rate analysis, EMR data, and workforce insight to understand why outcomes vary.
May 8, 2026
Learn how behavioral health leaders can use completion-rate analysis, EMR data, and workforce insight to understand why outcomes vary.
Learn how behavioral health leaders can use completion-rate analysis, EMR data, and workforce insight to understand why outcomes vary.
Most behavioral health leaders already know their completion rate. The harder question is why that number changes by site, program, clinician, referral source, or level of care.
EMRs and other systems of record are useful because they show what happened. They can show admissions, discharges, length of stay, discharge type, documentation patterns, and other core operating data. But completion-rate analysis requires another layer: the ability to connect those outcomes to workforce patterns, engagement, therapist fit, team dynamics, and staff development opportunities.
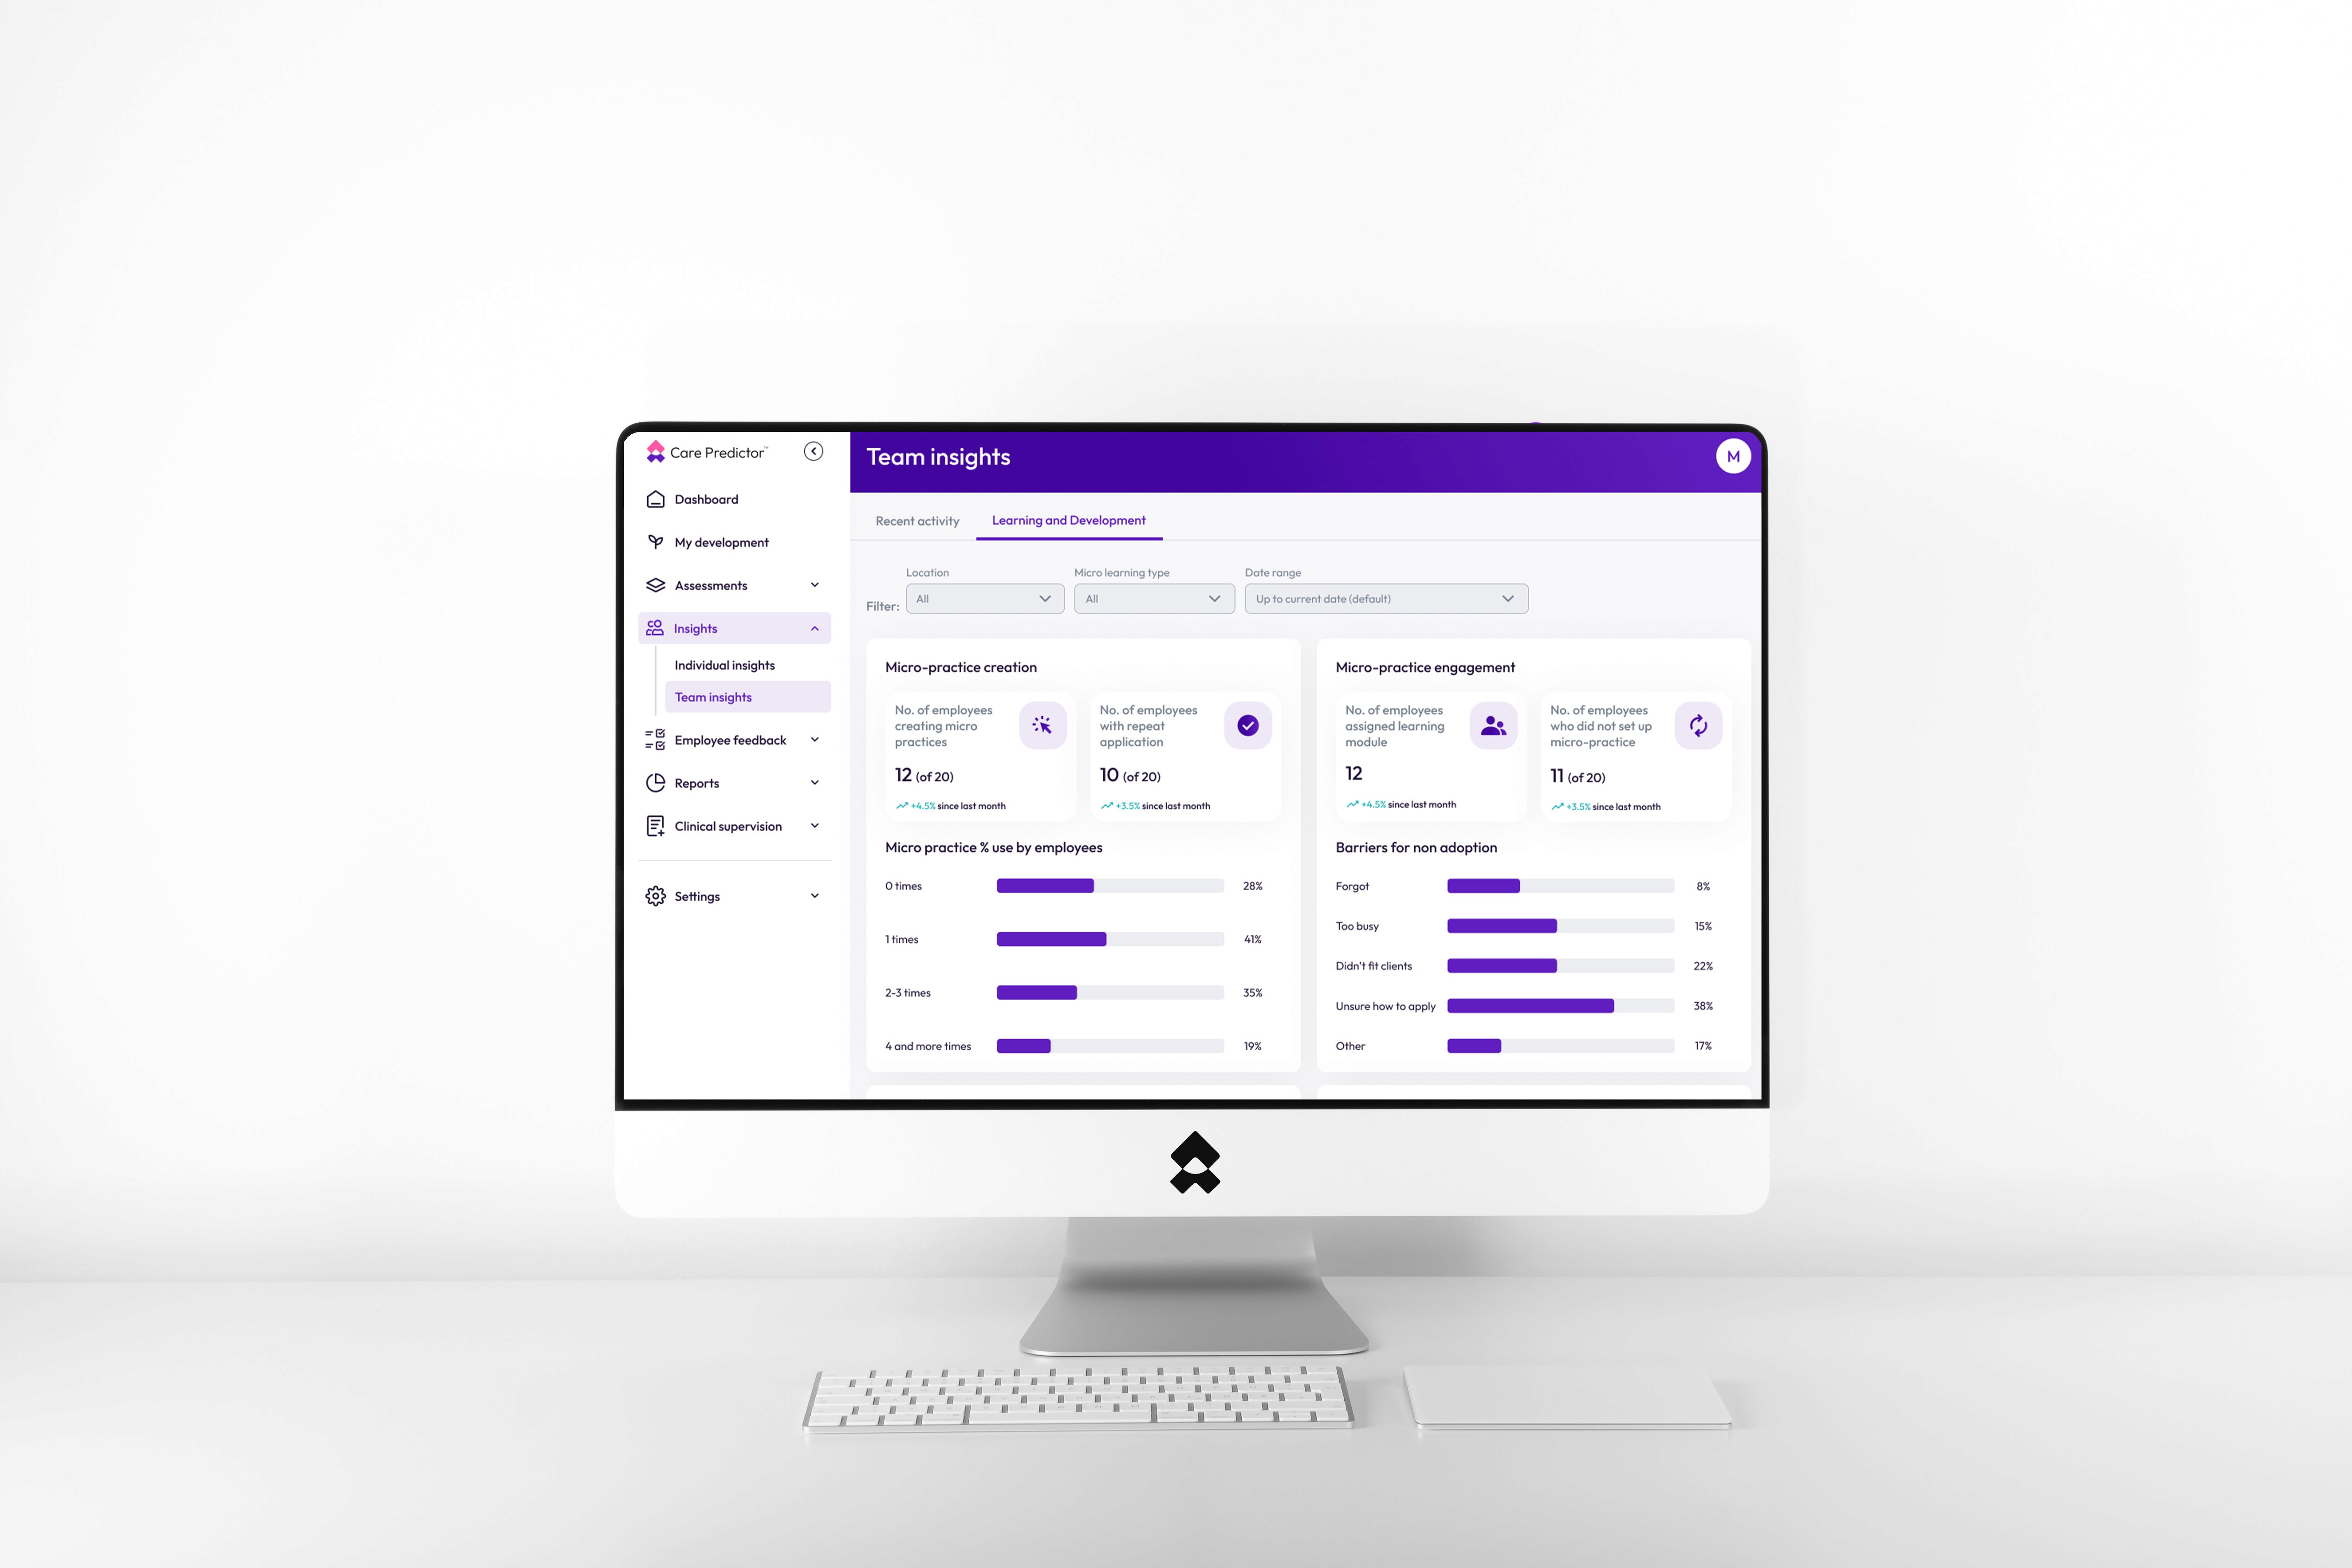
Care Predictor helps behavioral health organizations make that connection. It works alongside systems of record to help executives, clinical leaders, and HR teams understand the human factors that may influence completion, AMA, engagement, retention, and workforce performance.
Completion rate analysis is the process of looking beyond the completion percentage to understand what may be driving it.
Completion-rate reporting tells leaders the result. Completion-rate analysis asks the next question: why did that happen?
For behavioral health leaders, that question matters because completion is tied to clinical continuity, census stability, staff consistency, and financial performance.
Completion rates rarely move because of one simple factor. Two programs can offer the same level of care, serve similar populations, and use the same EMR, but still see different completion and AMA patterns.
Common completion-rate drivers include:
For completion-rate analysis, an EMR may help leaders see data such as:
This information matters. Without it, leaders may not have a reliable view of completion, AMA, length of stay, or program-level outcomes.
But EMR data is usually strongest at showing the record of care. It tells leaders what happened. It does not always explain why it happened.
Completion-rate variation may be connected to factors that do not always show up clearly in standard clinical outcomes reporting, including:
| Leadership Question | EMR Reporting | Behavioral Health Outcomes Analytics | Care Predictor | | --- | --- | --- | --- | | What happened? | Tracks admissions, discharges, documentation, and care activity | Organizes outcome trends across programs, sites, and populations | Uses system-of-record data as part of the broader performance picture | | Where are outcomes varying? | May show variation by site, program, clinician, or discharge type | Helps leaders compare patterns across teams and time periods | Helps leaders see variation connected to people-side performance drivers | | Why might outcomes be varying? | Often limited without additional context | Depends on the analytics approach | Helps identify staff strengths, role fit, relational patterns, and development opportunities | | What can leaders do next? | May require manual interpretation | Can support quality improvement planning | Helps turn insight into staff development and leadership action | | Does it replace the EMR? | Not applicable | No | No. Care Predictor works alongside systems of record |
A useful quality improvement dashboard should help leaders look at:
Care Predictor is not an EMR, CRM, or RCM platform. It works alongside systems of record to help behavioral health organizations understand the workforce patterns behind care performance.
In a Journal of Behavioral Health and Psychology study across five behavioral health organizations, higher Care Predictor Index scores were associated with higher treatment completion rates and lower AMA rates.
That does not mean a CPI score alone causes a patient to complete treatment. It means workforce characteristics can be measured, studied, and compared against outcomes that behavioral health leaders already care about.
Want to see Care Predictor in action?
Book a call with our team.